Working in the editor
An editor for a general-purpose language spends most of its energy guessing: what does this name mean, what shape does this value have, what would happen if you ran it. An editor for Flux guesses far less, because the language hands it more to work with. Every value carries a kind, every program is a graph, and every evaluation is deterministic — the properties Guide §11 watched the compiler prove. So the tooling can filter a completion list by dimension, show you the value of a binding at the step under your cursor (the bar, in charting), and tell you why a signal is true — without running anything twice.
This chapter is a tour of what that tooling does, and, more usefully, why it can. Nothing below is a separate feature bolted on after the fact; each one falls out of a property the language already guarantees. When a capability seems to know something an editor “shouldn’t” be able to know cheaply, the reason is always the same: the graph is already typed and already computed, so the answer is a lookup rather than a run.
What the editor really edits is a view — the island the engine paints. A chart is the
island that runs end-to-end today; the same typed graph and the same live loop reach a dashboard,
a scene or a small application — the display and App planes those need are sealed design, rolling
out after the chart. This documentation’s own editor is one such island, rendered live by the real
engine: the strongest claim a language’s tooling can make is the one you can watch it make.
Code intelligence
Completion, filtered by kind
Type a . after a record and you get its members. Type it after a stream and you get only
the functions whose first parameter accepts that kind:
close.          // → ema, sma, rsi, highest, … (everything that accepts a `price`)
rsi(close,14).  // → ema, sma, change, … (kind-preserving families) — but NOT `vwap`
The exclusions are the half worth reading. vwap wants a signal, so it is never offered
after a price. Neither is atr — for a different reason: it reads high, low and close itself
and takes only a length, so it has no source parameter for close. to fill. close.atr(14) is
[ErrArg], and a list that offered it would be handing you a line that does not compile.
That is the payoff of method-style chaining: it turns the type system into a discovery
mechanism. You do not need to know the catalogue; you need to know what you have. And at the
head of an empty line, the editor offers the output verbs — plot, def, let, mark,
alert — so a newcomer discovers that plot is how a value reaches the screen, instead of
having to know it in advance.
Signature help and hover
Typing ema( opens ema(source: price, length: lit) → price, with the current argument
highlighted.
A hover on an operation gives its documentation, its kind signature, a miniature example, and a live sparkline of that operation on the data currently on screen. A hover on a binding gives its inferred kind and its value at the step under the cursor.
That last one is worth pausing on: it is possible because evaluation is deterministic and the graph is already computed. There is no “debug build,” and nothing is re-run — the hover reads a value the runtime has in hand.
Diagnostics that teach
price + osc — you are adding a price and a 0–100 oscillator.
  close + rsi(close, 14)
          ^^^^^^^^^^^^^^ osc(0,100), a dimensionless bounded value
  Did you mean  close + atr(14)  (a price + a displacement)?
Three kinds of help sit behind that message:
- Dimensional explanations. A kind mismatch is explained in terms of what the values are, never in terms of the type checker’s internals.
- Did-you-mean. An unknown name, a missing field, a misspelled kernel — matched by edit distance against the names in scope, the catalogue, and the record’s fields, all of which are already materialized for completion.
- “You forgot
plot.” A bare expression at the top level is a syntax error — the grammar has no expression-statements, and that stays frozen. But when the expression’s kind is presentable, the editor recovers it pedagogically: “to show this, wrap it inplot,” with the quick-fix. The language stays strict; the experience does not.
Inlay hints
h = macd(close).hist                ⟦level · −12.3⟧
m = ema(close, 20) @ tf("1h")       ⟦price · @1h⟧
The ⟦…⟧ is not text in your file — it is rendered beside it. It shows the kind, the value at
the cursor step, and — when a binding runs on a non-default clock — its clock provenance. You
can see that a value comes from the hourly series, without the language having to encode the
timeframe in the type, which would break the confluence idiom the whole design is built to
allow.
The novice register
Warnings and style lints are deferred until your first green compile, then revealed opt-in. Day one never shows a wall of nags. The hard/soft classification of the error channel is unchanged — this is a presentation policy, not a semantic one.
The canonical formatter
Format on save, with no options to argue about — and one specific job beyond tidiness: it neutralizes the significant-newline trap. It normalizes line breaks and continuation indentation so the extent of every statement is visible. A newcomer never has to guess where an expression ended.
Semantic colouring by kind
Prices, oscillators, signals and canvas primitives are coloured differently from one another — not by syntactic category, but by what they are. It is a small thing that turns out to matter: you see the shape of a program’s dimensions before you read it.
Live preview
The editor compiles on idle, after a short debounce, and applies the result to the chart. When
there is an error, it does not blank the preview: it evaluates the typable cone — the
largest part of the graph whose every input is free of errors — and renders the rest as —.
The last valid version is a fallback only if the cone is empty.
The consequence is worth stating plainly: a half-typed name costs you one value, never the screen.
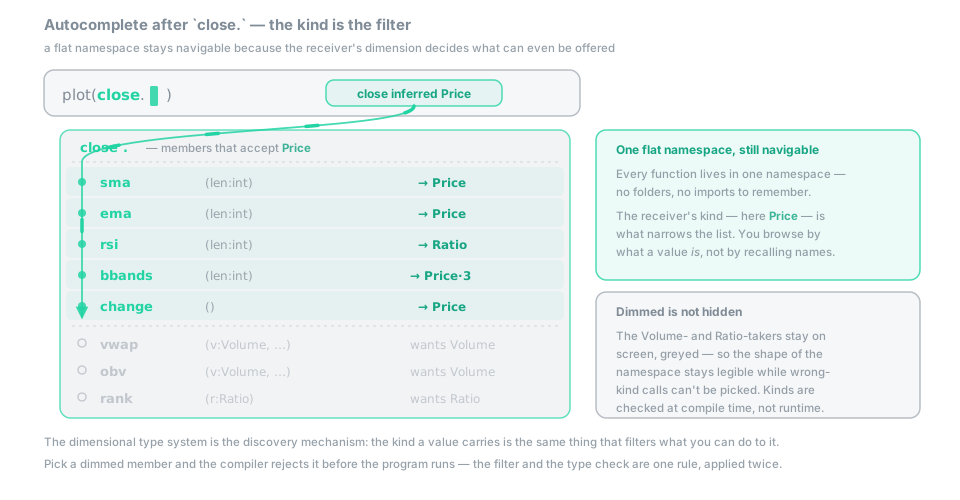 Figure — a single erroring node types to a contained hole; the cone of clean nodes still
renders, and only the values downstream of the fault show as
Figure — a single erroring node types to a contained hole; the cone of clean nodes still
renders, and only the values downstream of the fault show as —.
Once the program compiles, the status chip tells you what it earned:
✓ No-repaint   ✓ No look-ahead   ✓ Deterministic   ✓ Bounded memory   ✓ Byte-identical
⚠ contains live() → non-replayable
Each tick is a guarantee the compiler proved, not a badge it assigned by convention — and each warning names the one construct that cost you one, so you always know what you traded and why.
For an application, hot reload generalizes: the host re-folds the retained message journal with
the new update, without calling init — so your application’s state survives an edit. A
change of shape falls back to the migration path; it is never a silent reset.
Debugging a graph
A Flux program has no call stack, so an imperative debugger would be answering a question nobody asked. What a program has is a graph of typed signals over an ordinal axis — so the cursor is two-dimensional: when (which bar) × what (which node). Every movement below is one way of reading that grid.
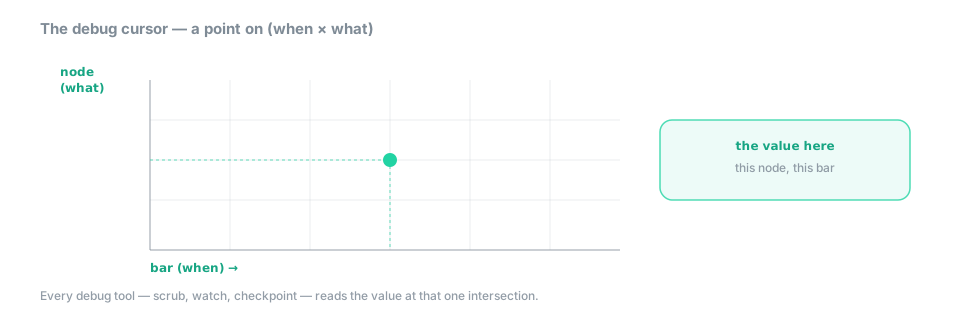 Figure — the debug cursor is a point on a grid of bar (when) against node (what); every tool
below reads or moves that point.
Figure — the debug cursor is a point on a grid of bar (when) against node (what); every tool
below reads or moves that point.
| Movement | What it is |
|---|---|
| Ambient values | the inlay hints already show every binding’s value at the cursor bar. There is no mode to enter. |
| The chart is the scrubber | a playhead on the chart is the bar cursor — drag it, or use the arrow keys. No separate timeline. |
| The probe | scrub to a bar and read the table of every binding’s value there. Deterministic, so it is exact rather than sampled. |
| The dataflow view | the compiled graph, rendered as a graph — because that is what it is. Click a node: the source highlights and its series appears. |
| The causal cone | “why is this signal true here?” — highlight everything the value at this bar actually depended on. |
| Data breakpoints | not a line breakpoint but a data one: “go to the first bar where macd cross_up 0”. The series is already computed, so the jump is a search, not a re-run — it is instant. Likewise: the next event, the next na, the next divergence. |
| Time travel | replay is exact, so stepping backwards is not an approximation; it is the same computation. |
The through-line is that none of these re-runs your program. Because the series are already materialized and the computation is deterministic, “go to the next crossing” is a search over data you already have, and “step backwards” is the same numbers read in the other direction.
For an application, these same movements transpose to an (event, field) cursor over the message
journal: the data breakpoint becomes “the first message where score crosses 40,” time travel
becomes reverse-step along the journal, and the trust lens becomes a diff of the model against a
reference run. The bar-axis debugger above is v1; its application twin lands with the App plane.
Sliders, and the parameter model
input(14, 2..200) renders a slider in the gutter. What happens when you drag it is the
part worth knowing:
The tuned value lives in a parameter overlay, not in the source literal. The source carries the default. Dragging updates a parameter and re-runs the incremental step — it does not recompile, does not mutate your source, and does not flood your undo history.
The unit that is persisted, shared and replayed is therefore (source hash, parameters) — one
compiled module, many tunings, with byte-identity on (artifact, parameters) → output. “Bake
default” is an explicit action, and the only path that writes an overlay value back into the
source.
A parameter with a declared range is bounded by its maximum: memory is sized for the worst case, so dragging a slider can never allocate. The work behind the slider is knowable before you touch it.
The performance HUD
Per script, the HUD reports the node count, the cost per bar, the canvas frame budget — and a warning when a script is heavy. This is compile-counted, bounded work, read off the graph rather than measured after the fact: the cost gutter reads the optimized graph, so what you see is what you pay.
Doc-as-data
The hover card, the completion list, this documentation, the error messages and the snippets all render from one structured record per function, kind, keyword and operator. They cannot drift, because they are the same data.
A completeness lint keeps it honest: every construct in the language has a documentation record and at least one runnable example — and every example is a golden. A documented function whose example stops working turns a test red, which is the only kind of documentation guarantee worth having.
See also
- Kinds — what kind-filtered completion is filtering on, and the semantic colours you see.
- Your first session — the editor as you first meet it.
- Determinism, replay and trust — what the status chip is actually asserting.
- Inference & the error policy — the typable cone, and why a broken line does not blank the preview.
- FDK overview — doc-as-data, and the completeness lint.
The formal rules → Everything above is taught intuition; the normative statements live in the spec, the FVM and the FDK.
- Typing an unfinished program and incremental re-typing — the typable cone that keeps the live preview alive under a broken edit.
- The error policy and what an error message is — every
[Err…]/[Warn…]code, and the anatomy the teaching diagnostics render from.- Presentation is inferred, not configured — the kind → registry mapping behind semantic colouring and the sparkline preview.
- The cost model — the optimized graph the performance HUD reads, so the cost gutter shows what you actually pay.
- Undo, redo and time travel come free and schema evolution — the retained message journal that hot reload re-folds, and the migration path a shape change takes.
- The seven guarantees and the guarantees panel — what each tick on the status chip asserts, and what it costs to lose one.